
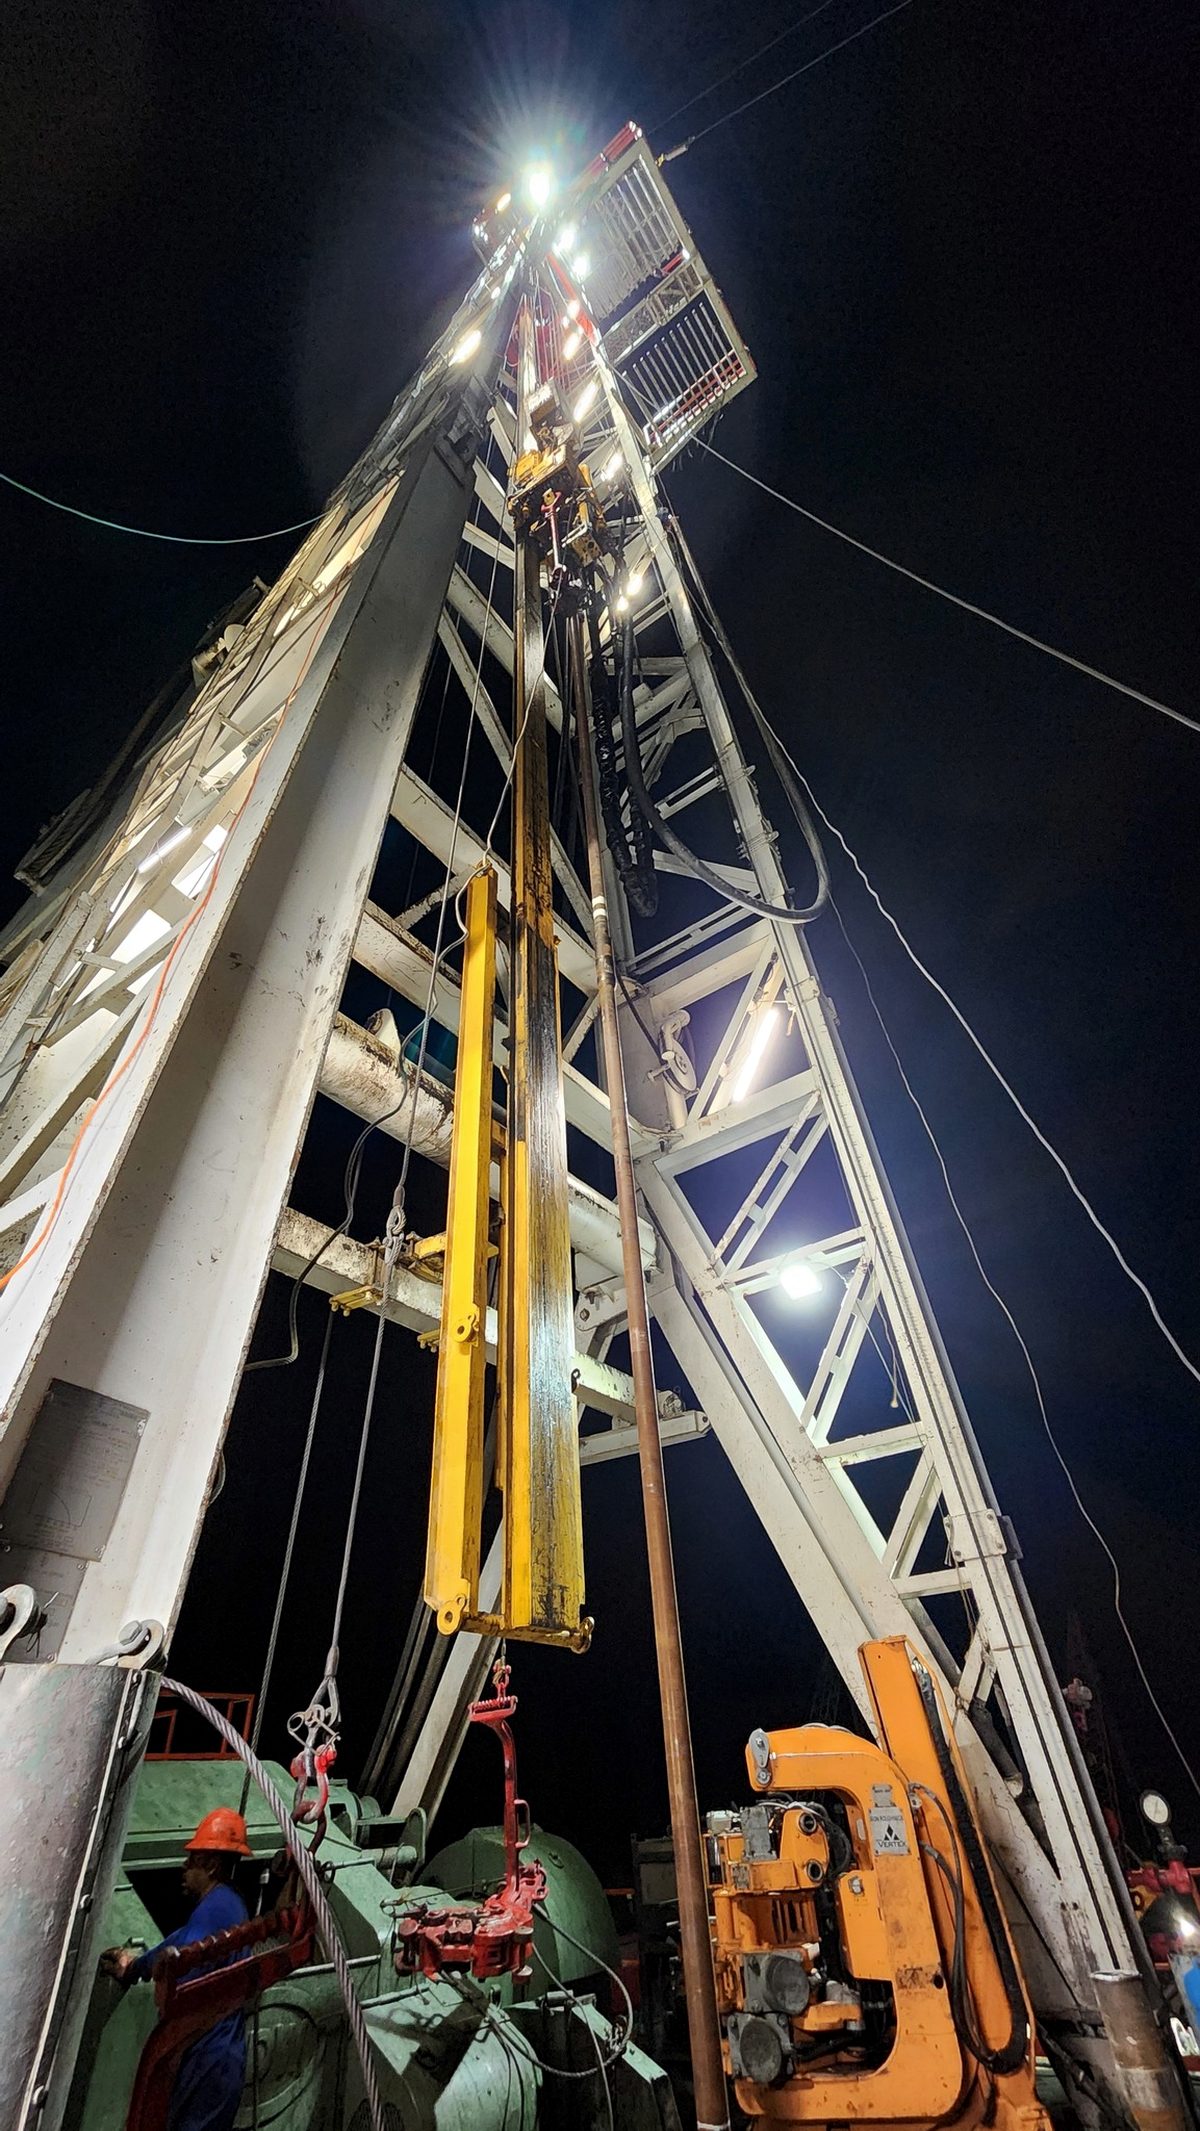
True drilling ROP optimization requires pairing surface penetration rate (footage drilled divided by on-bottom time) with downhole measurements of torque, weight on bit, vibration, and stick slip. Surface ROP tells you how fast the block moved. Downhole data tells you why. Without both, operators chase parameter changes that look faster on the rig floor while destroying bit life and adding hidden NPT.
Specialized Energy Services provides directional drilling, rotary steerable, MWD, and real-time geosteering services to operators in the Permian Basin, Delaware Basin, and South Texas, and across 134 wells and 1,974,067 feet drilled we have seen the same pattern repeat: the wells that beat the offset curve are not the ones with the highest instantaneous ROP. They are the ones where downhole dynamics stayed inside a controlled window from the kickoff point to TD.
What Is Drilling ROP and How Do You Actually Calculate It?
The base formula is simple. As SinoDrills lays out in its ROP guide, rate of penetration equals distance drilled divided by time taken, and connections, surveys, and equipment adjustments must be excluded so the number reflects only time the bit was on bottom making hole.
That is where most operators stop, and that is where the measurement starts lying to you. A few common distortions:
- Averaged interval ROP hides the stalls. A 90 ft/hr average across a 1,000 ft interval can contain a 400 ft stretch at 140 ft/hr and a 300 ft stretch at 40 ft/hr fighting a hard stringer.
- On-bottom time is often recorded loosely. If reaming, back reaming, and slide setup bleed into the drilling clock, your ROP is understated and your NPT is overstated.
- Surface WOB is not bit WOB. In a long lateral, drillstring drag can consume a meaningful share of applied weight before it reaches the cutting structure.
- Surface torque is filtered by the drillstring. Torsional oscillation that shows up as a mild wiggle on the rig floor can be severe stick slip at the bit.
Academic and field literature treats ROP as a dependent variable, not an input. ScienceDirect defines rate of penetration as the speed at which the bit advances into rock, influenced by hydraulics, weight on bit, rotary speed, and rock properties. You do not set ROP. You set parameters, and ROP is what the formation gives back.
Model-Based ROP Formulas and Their Limits
Classic ROP models express penetration rate as a function of bit weight, rotary speed, and rock compressive strength. The Drilling Manual breakdown of factors affecting ROP walks through the relationship between RPM, threshold bit weight, and compressive strength. These models are useful for planning a well and setting expectations by interval. They are not useful for real-time decisions, because they assume the drillstring is transmitting energy cleanly. In a Delaware Basin curve with a 10,000 ft lateral behind it, that assumption breaks down fast.
Why Do Surface ROP Metrics Miss Critical Subsurface Performance Data?
Because the two ends of the drillstring are living in different worlds. The block moves smoothly. The bit does not. Three failure modes cost footage while the surface readout looks acceptable:
Stick Slip
The bit stops, torque winds up in the string, then the bit releases and overspeeds. Average surface RPM looks steady. Instantaneous bit RPM swings from zero to multiples of the setpoint. This shatters cutters, twists off downhole tools, and produces the classic signature of decaying ROP through a bit run that nobody can explain from surface data.
Lateral Vibration and Whirl
Backward whirl generates high-frequency impact loading that wrecks bearings, gauge pads, and MWD electronics. It also enlarges the hole, which quietly increases tortuosity and makes casing runs harder. Very little of this reaches the rig floor as a usable signal.
Axial Vibration and Bit Bounce
Intermittent loss of bit contact means your effective WOB is far below what the driller is pulling up. Adding weight at surface often makes it worse.
Drilling Contractor makes the point directly: effective real-time drilling optimization depends on a specialized downhole dynamics MWD tool that records and transmits stick slip, whirl, downhole WOB, and downhole torque, so surface parameters can be adjusted against actual downhole conditions in a continuous feedback loop. That is the entire argument for measuring below the rotary table instead of above it.
How Do You Use MWD and AI Analytics to Find Real Optimization Opportunities?
The workflow we run on Permian and South Texas wells is built around closing the loop between what the driller sets and what the bit feels. It is repeatable, and any operator can adopt the discipline.
1. Establish a Clean Measurement Baseline
Before you optimize anything, fix your data hygiene. Define on-bottom time the same way on every well. Separate rotating ROP from sliding ROP. Tag every non-drilling event by category so the NPT ledger is honest. Optimization built on dirty footage accounting produces false wins.
2. Monitor Mechanical Specific Energy, Not Just ROP
MSE expresses the energy required to remove a unit volume of rock. Rising MSE at constant ROP means you are burning energy on vibration, bit dulling, or founder rather than making hole. ScienceDirect notes that Dupriest and Koederitz applied MSE to evaluate bit efficiency in real time, giving drillers a continuously calculated efficiency signal alongside other surface measurements. MSE trending is the single cheapest upgrade to a drilling performance program because it uses data you already have.
3. Run a Disciplined Founder Test on Every Bit Run
Step WOB up in fixed increments at constant RPM and record ROP and MSE at each step. ROP climbs linearly until the founder point, then flattens or reverses while MSE spikes. Repeat at a second RPM. You now have an empirical parameter map for that formation instead of a rule of thumb. Document it by interval so the next well starts where the last one finished learning.
4. Correlate Downhole Dynamics to Parameter Changes in Real Time
This is where real-time downhole data cuts NPT and spud to TD time. Our GT-MWD platform streams dynamics and downhole drilling parameters, and AI Driller analytics flag the correlations a human watching six traces will miss: the RPM band where stick slip severity crosses a threshold, the flow rate where motor differential becomes unstable, the WOB step where MSE decouples from ROP. Research published in MDPI on automated penetration rate algorithms with vibration control describes the same principle: continuously adapting the drillstring model against live data lets you characterize the safe operating region and adjust WOB and RPM proactively instead of reactively.
5. Benchmark Against Offsets by Interval, Not by Total Days
Total spud-to-TD days is the scoreboard, not the diagnosis. Break every offset well into surface, intermediate, curve, and lateral segments, then compare rotating ROP, sliding percentage, connection time, and tool reliability per segment. When our fastest wells came in at 2.11 days in Dimmit County and 4.13 days in Lea County, New Mexico, the gains were not one heroic push. They were accumulated interval by interval, with 98.97% tool reliability across the program keeping trips out of the equation.
Where Does the Directional Program Fit Into ROP Optimization?
You cannot separate penetration rate from steering strategy. Three decisions dominate:
- Steering system selection. Rotary steerable systems like PowerDrive Orbit G2 and iCruise hold continuous rotation, which eliminates the sliding ROP penalty and delivers a smoother hole. High-torque motors remain the right call in specific intervals and hole sizes. The honest tradeoffs are laid out in our rotary steerable system versus mud motor comparison.
- Trip count. Every round trip is hours of zero footage. Running the curve and lateral in one run removes a bit trip and a survey sequence from the well plan entirely, which moves the average ROP for the whole well more than any parameter tweak will.
- Wellbore quality. A tortuous hole taxes you for the rest of the well through drag, poor weight transfer, and completion difficulty. The techniques in our guide to reducing wellbore tortuosity in extended reach laterals protect the downhole WOB you need to sustain high ROP deep in the lateral.
What Should You Change on Your Next Well?
Pick three things and do them consistently:
- Require downhole dynamics data (stick slip, whirl, downhole WOB and torque) as a deliverable, not an upsell, and put it on the same log as surface parameters.
- Run a founder test on every new bit and formation combination, and write the parameter map into the next drilling program.
- Report ROP by interval with a defined on-bottom time convention, alongside MSE and tool reliability, so performance conversations are about causes instead of averages.
Do that and the drilling efficiency metrics stop being a monthly slide and start being a control system.
Put Real Downhole Data Behind Your Next Permian or South Texas Well
Specialized Energy Services runs rotary steerable systems, high-torque downhole motors, GT-MWD, live geosteering, and AI Driller analytics across the Permian Basin, Delaware Basin, and South Texas. Send us your offset data and target well plan, and we will build an interval-by-interval ROP benchmark, identify where your current program is losing footage, and put a directional and measurement package behind it. Contact Specialized Energy Services to start the review before you spud.
How do you calculate rate of penetration in drilling?
Rate of penetration equals distance drilled divided by the time taken, with connections, surveys, and equipment adjustments excluded so only on bottom drilling time is counted. The weakness is that averaged interval ROP hides stalls, so a 90 ft/hr average can contain a fast section and a slow stringer. Report ROP by interval with a consistent on bottom time convention and separate rotating ROP from sliding ROP.
Why does surface ROP miss what is happening at the bit?
The block moves smoothly while the bit does not. Drillstring drag consumes part of the applied weight so surface WOB is not bit WOB, and the string filters torsional oscillation so severe stick slip at the bit can look like a mild wiggle on the rig floor. Downhole dynamics measurements of stick slip, whirl, downhole WOB, and downhole torque are what close that gap.
What is mechanical specific energy and why track it alongside ROP?
MSE expresses the energy required to remove a unit volume of rock, which makes it a continuously calculated efficiency signal. If MSE rises while ROP stays flat, energy is going into vibration, bit dulling, or founder instead of making hole. It is the cheapest upgrade to a drilling performance program because it uses data you already collect at surface.
How do you run a founder test on a bit run?
Step WOB up in fixed increments at constant RPM and record ROP and MSE at each step. ROP climbs linearly until the founder point, then flattens or reverses while MSE spikes. Repeat the sequence at a second RPM, document the results by interval, and write the resulting parameter map into the next drilling program.